What This Tutorial Covers
An iron condor and an iron butterfly are built from the same four pieces: a long put, a short put, a short call and a long call. This tutorial puts one of each on the same SPX expiration in the MyATMM Risk Profile tool, November 18, and compares how each one is drawn: the condor’s flat-topped tent against the butterfly’s single peak, both pairs of breakevens and the max risk chip. Then the Strategy Summary page rolls both into one row. Everything happens on a demo account.
It is a demonstration of a tracking tool. Nothing here is investment advice; it shows how positions get drawn and tracked, not what to trade. For a step-by-step build of the condor on its own, see building and reading an SPX iron condor risk graph.
Step 1: Start From the Saved Iron Condor
The condor is already saved on November 18: buy the 7450 put, sell the 7500 put, sell the 7700 call and buy the 7750 call, for an 18.80 credit. Its green expiration line is a tent with a flat top, the full $1,880 anywhere between the two short strikes. The breakevens sit at 7481.20 and 7718.80, and max risk is $3,120: one fifty-point wing ($5,000) minus the credit.
Step 2: Add a Second Profile on the Same Date
The plus button starts a new profile. Name it Iron Butterfly and pick November 18 again as the target expiration. One date can hold several profiles as long as their names differ. Create Profile saves it, and the Profile picker at the top of the page now lists both.
Step 3: Build Four Legs
The build starts the same way as the condor. Add First Spread opens the inline editor with a two-leg call vertical. Add Leg twice makes four legs, the type button flips the first two to puts, and two clicks on the chain icon unlink the strikes so each one can be typed on its own. With four different strikes, the spread label still reads Iron Condor.
Step 4: Collapse the Body to One Strike
The demo butterfly uses these strikes:
- Buy the 7550 put
- Sell the 7600 put
- Sell the 7600 call
- Buy the 7650 call
Both short legs share one strike, right next to where SPX is trading in the demo, and the moment they match, the label switches to Iron Butterfly. The wings are still fifty points wide, the same as the condor. Only the body has changed, from two short strikes to one.

The label reads Iron Butterfly as soon as both short legs sit at 7600. The price is still following live quotes here, before the lock.
Step 5: Lock the Price and Enter the Credit
The lock switches the price field to manual entry. The demo enters 43.00, the credit for the whole butterfly: $4,300 on one contract, more than twice the condor’s credit. Both short options sit at the money, which is where an option carries the most time value. The check mark saves the spread, and the chart redraws with the real strikes.
Step 6: Read the Peak
Max risk is $700: the fifty-point wing is $5,000, minus the $4,300 credit. The expiration line is no longer a flat-topped tent, though. It is a peak:
- The full $4,300 shows up only with SPX finishing right at 7600
- The line drops away on both sides, through breakevens at 7557 and 7643
- It flattens at the $700 max loss below 7550 and above 7650
Each breakeven is the body strike shifted by the credit: 7600 − 43 = 7557 and 7600 + 43 = 7643.
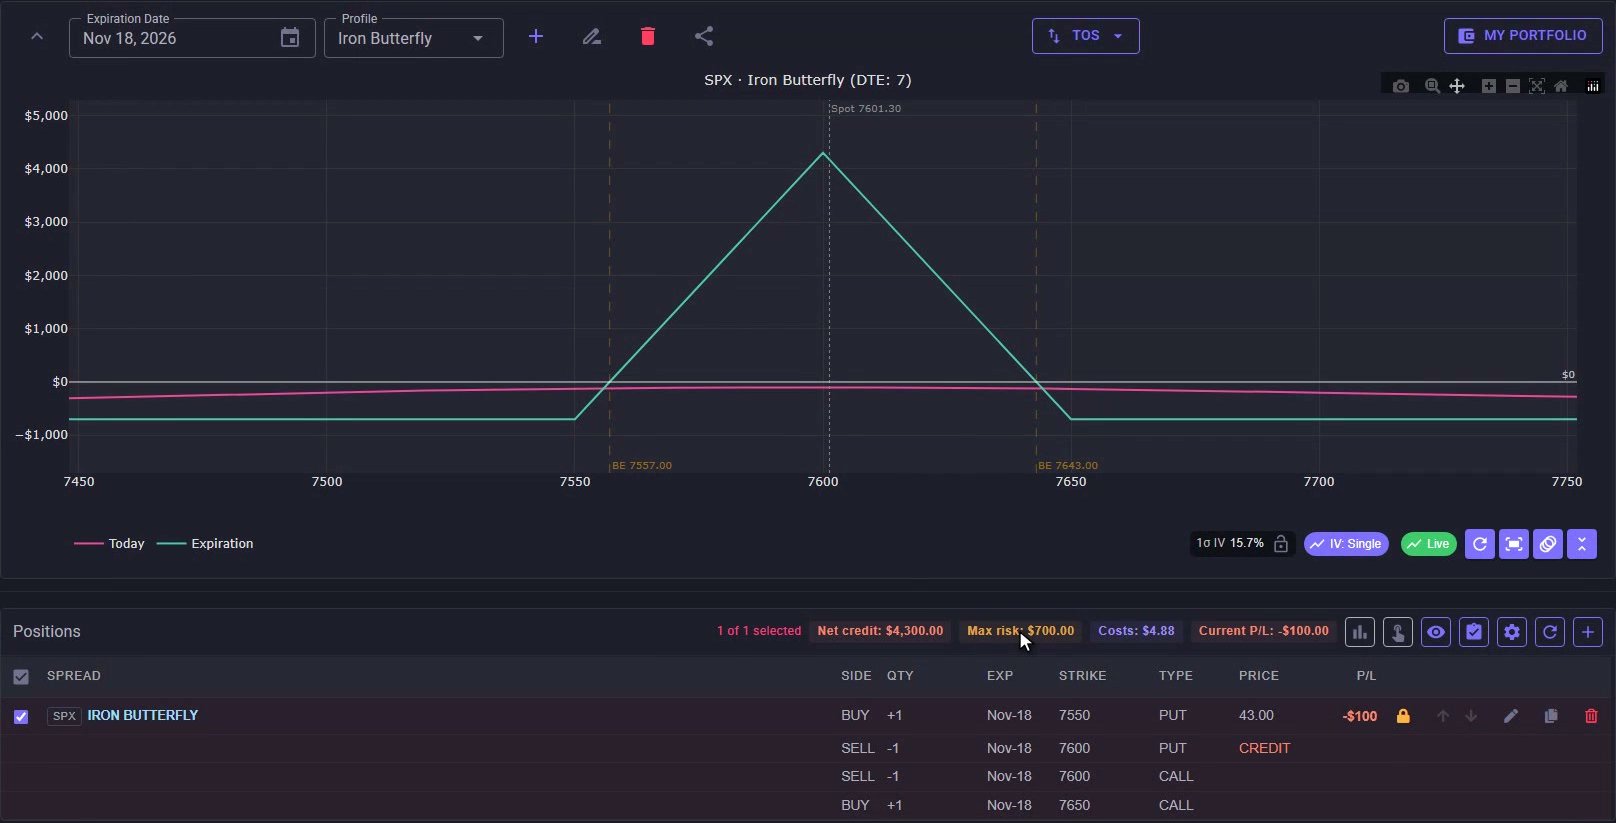
The butterfly’s peak at 7600, breakevens at 7557 and 7643, and the $4,300 net credit and $700 max risk chips above the four legs.
Step 7: Compare the Two Shapes
The Profile picker flips between the two profiles without leaving the date. Side by side:
| Iron condor | Iron butterfly | |
|---|---|---|
| Short strikes | 7500 put / 7700 call | 7600 put / 7600 call |
| Wing width | 50 points | 50 points |
| Net credit | $1,880 | $4,300 |
| Max risk | $3,120 | $700 |
| Breakevens | 7481.20 / 7718.80 | 7557 / 7643 |
| Breakeven gap | About 238 points | 86 points |
| Expiration line | Wide, flat top from 7500 to 7700 | A single peak at 7600 |
Same expiration, same wing width, two very different shapes on the chart.
Step 8: One Combined Row on Strategy Summary
Strategy Summary, under Tools, puts the two back together. On the Upcoming Expirations tab, November 18 is one row: two transactions, eight legs, the credit booked so far net of estimated fees, and one max risk. The check mark beside it explains the number: the combined max risk across both saved profiles, read off their combined P&L curve.
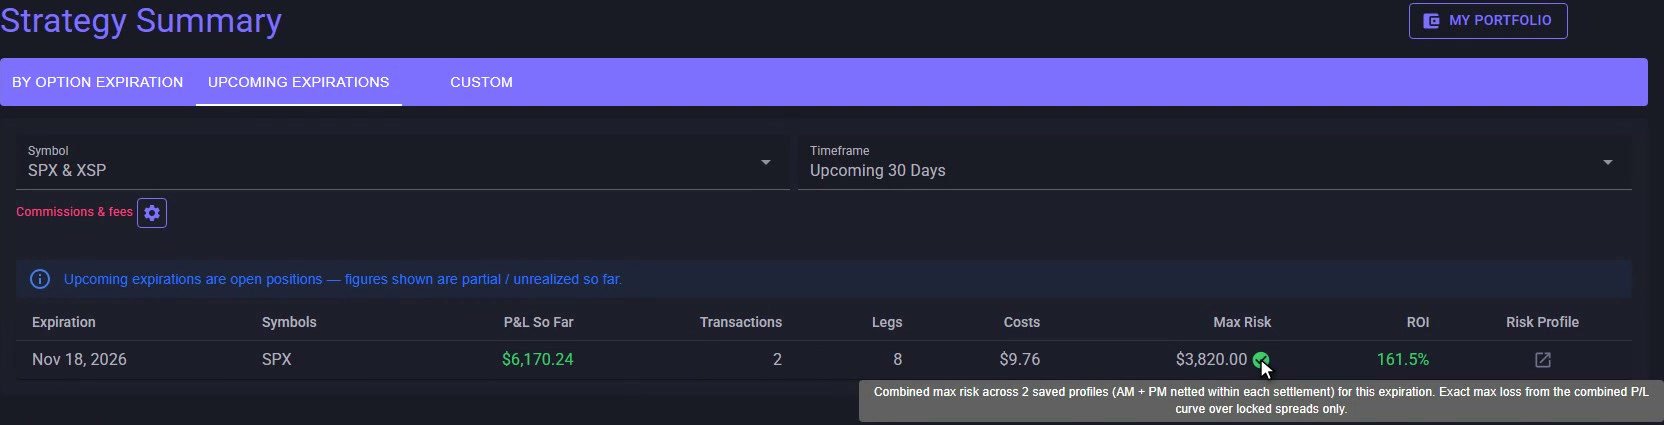
Strategy Summary, Upcoming Expirations: one Nov 18 row for both profiles, with the combined $3,820 max risk and the check mark’s explanation.
Two Profiles, One Date, One Row
That is an iron butterfly next to an iron condor in MyATMM: two profiles on one expiration, two shapes on the chart and one combined row on Strategy Summary. The SPX credit spread and iron condor transactions on the cost basis side feed that row, and the profiles supply the risk. If you are comparing tools for multi-leg index positions, see the best iron condor tracker apps for 2026.
Risk Disclaimer
Options trading involves risk and is not suitable for all investors. Past performance does not guarantee future results. This content is for educational purposes only and should not be considered financial advice. The positions shown are demo data. Always consult with a qualified financial advisor before making investment decisions.
Related Reading
- How to build and read an SPX iron condor risk graph — the condor in this comparison, built step by step
- How to build and read an SPX call credit spread risk graph — one wing on its own
- How to track SPX and XSP option P&L by expiration — the Strategy Summary page in full
- How to share an options risk graph as a read-only link
- The best iron condor tracker apps for 2026
Start Tracking Your Options Positions Accurately
MyATMM provides purpose-built cost basis tracking for option sellers, with the flexibility to track covered calls, cash-secured puts, and wheel strategy positions.
Track up to 3 tickers completely free forever. No credit card required.
Create Your Free Account TodayBuilt for covered calls, cash-secured puts, and the wheel strategy