What This Tour Covers
This is a three-minute tour of the MyATMM Strategy Summary page, which rolls up index option trades on SPX and XSP by expiration date so each expiration becomes one line with its own profit or loss. The example is a demo account holding a handful of put spreads and an iron condor. It is a demonstration of a tracking tool: it shows how positions get tracked, not what to trade. The rows come from ordinary cost basis transactions; to see how those get entered, start with how to track SPX credit spreads and iron condors in MyATMM.
Step 1: Set the Symbol and Timeframe Filters
Two filters sit across the top. Symbol narrows the table to SPX, to XSP, or both together. Timeframe picks the window of expiration dates and defaults to the last seven days. The gear next to Commissions & fees opens the per-contract costs that feed the Costs column, covered in Step 3.
Step 2: Read a Row
Each row is one expiration date:
- Symbols — which index traded that day.
- Profit / Loss — the net of every credit and debit booked against that expiration, green when positive, red when negative.
- Transactions and Legs — the number of fills and option legs behind the number.
- Costs — the commissions and fees the broker took. They are already baked into the profit or loss and shown separately so they are not hidden.

By Option Expiration: one line per date, with the broker's costs shown next to the net result.
Widening the timeframe to the last fourteen days pulls in two more expirations. The totals stay per expiration, so a losing date and a winning date sit side by side instead of being blended into one account number.
Step 3: Set Commissions and Fees Per Contract
The gear opens the Commissions & Fees dialog: per-contract commission and fee figures for SPX, for XSP, and for equity options, saved per portfolio. The Costs column multiplies these by the contract count, so set them once to match the broker's schedule and every expiration's cost comes out right. Cancel leaves them as they are.
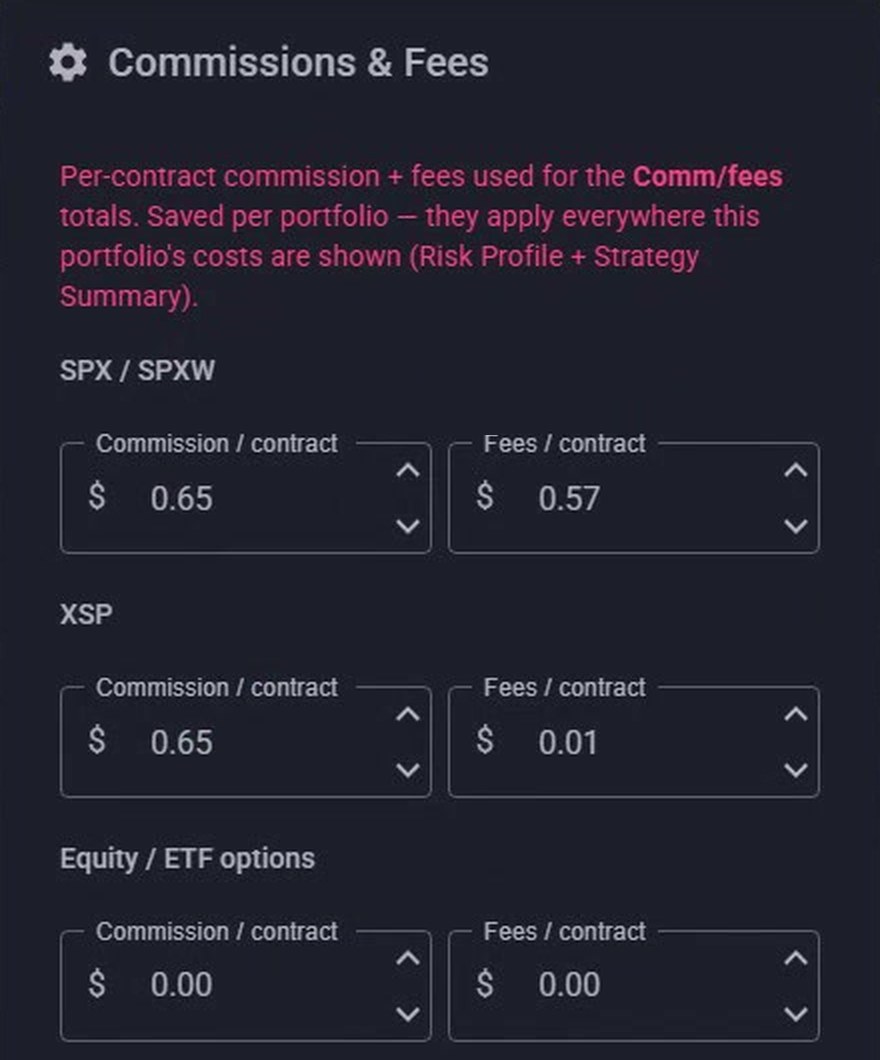
Per-contract costs, saved per portfolio, feed both Strategy Summary and the Risk Profile.
Step 4: Check Open Positions on the Upcoming Expirations Tab
The Upcoming Expirations tab is the same table for positions that have not expired yet, defaulting to the next thirty days. The banner is the reminder that these are still open: the P&L So Far column is only what has been booked to date, not a final result.
Step 5: Max Risk and ROI From a Saved Risk Profile
This is where the page connects to the Risk Profile tool. When a saved Risk Profile exists for an expiration, Max Risk shows that profile's exact maximum loss with a check mark, and ROI divides the profit or loss by it. In the demo the October 23 spread has a profile, so both columns fill in. The October 30 iron condor does not, so they stay blank until one is built.

Upcoming Expirations: Max Risk and ROI only appear for a date that has a saved Risk Profile.
Step 6: Group by Name on the Custom Tab
The Custom tab groups by name instead of by date. Any transactions tagged with the same group name roll up into one line with their combined profit or loss, which suits a strategy that runs across several expirations.
Step 7: Jump to the Risk Profile
The icon in the Risk Profile column opens the saved profile for that expiration, which is where the Max Risk number comes from. Transactions feed the summary, the Risk Profile supplies the risk, and the two stay linked by expiration date.
One Line Per Expiration
For index spreads the end-of-week question is usually how each expiration did, after fees, against the risk that was actually on the table. Strategy Summary answers that in one row per date, and the Custom tab answers it per named strategy. For the rest of what belongs in a trade record, see what to look for in options trading journal software. Three tickers are free forever, no credit card required.
Risk Disclaimer
Options trading involves risk and is not suitable for all investors. Past performance does not guarantee future results. This content is for educational purposes only and should not be considered financial advice. Always consult with a qualified financial advisor before making investment decisions. MyATMM is a tracking tool; nothing on this page is a recommendation to buy or sell any security.
Related Reading
- How to read a put credit spread risk graph — where the Max Risk number on this page comes from
- How to track SPX credit spreads and iron condors in MyATMM — entering the transactions that feed the summary
- The best credit spread tracker for options sellers in 2026
- The best iron condor tracker apps for 2026
- What to look for in options trading journal software
Start Tracking Your Options Positions Accurately
MyATMM provides purpose-built cost basis tracking for option sellers, with the flexibility to track covered calls, cash-secured puts, and wheel strategy positions.
Track up to 3 tickers completely free forever. No credit card required.
Create Your Free Account TodayBuilt for covered calls, cash-secured puts, and the wheel strategy