What This Tutorial Covers
This tutorial builds a four-leg SPX iron condor from scratch in the MyATMM Risk Profile tool, then reads what the risk graph says about it: the flat “tent” between the short strikes, the two breakevens, the max loss beyond the wings, and the way the saved profile feeds max risk and ROI on the Strategy Summary page. Everything happens on a demo account.
It is a demonstration of a tracking tool. Nothing here is investment advice; it shows how a position gets drawn and tracked, not what to trade. If you have not read a two-leg chart yet, start with building and reading an SPX call credit spread risk graph. An iron condor is that same picture with a put spread added on the other side.
Step 1: Create the Profile
Every risk profile is pinned to one expiration date. The plus button opens the New Risk Profile dialog. Leave SPX Family selected, name the profile (Iron Condor in the demo) and pick the target expiration, November 10 here. The dialog confirms whether that date settles in the morning or the afternoon, and Create Profile saves it right away, empty and ready for spreads.
Step 2: Add Four Legs
Add First Spread opens the inline legs editor with a placeholder: a two-leg SPX call vertical at the money. An iron condor needs four legs, so click Add Leg twice. Each new leg lands one strike higher, and the editor sets the sides for you: buy the outer legs, sell the inner ones. Buy, sell, sell, buy is the shape of a condor.
Step 3: Flip Two Legs to Puts and Unlink the Strikes
All four legs start out as calls. Click the type button on the first two legs to flip them to puts, and the spread label changes to Iron Condor. Strikes are linked by default, so typing into one leg would roll all four together. The chain icon cycles through linked, grouped by pair and unlinked; two clicks unlink them so each strike can be set on its own.
Step 4: Set the Strikes
The demo condor uses these four strikes:
- Buy the 7400 put
- Sell the 7450 put
- Sell the 7700 call
- Buy the 7750 call
That is a fifty-point put spread below the market and a fifty-point call spread above it, both sold, with the index sitting between the two short strikes. Tab out of each strike box and the editor checks it against the live option chain.

All four strikes set and unlinked. The price field is still tracking live quotes here, before the credit is entered.
Step 5: Lock the Price and Enter the Credit
The lock freezes the price for manual entry; unlocked, it keeps following live quotes. The demo enters 6.50, the credit received for the whole condor, which is $650 on one contract. The check mark saves the spread, and the chart redraws with the real strikes.
Step 6: Read the Chips
The chips above the Positions table total up the checked spreads:
- Net credit — the cash received, $650.
- Max risk — the most the position can lose, $4,350.
- Costs — the estimated commissions and fees.
- Current P/L — where the condor stands right now against live quotes.
Step 7: Read the Tent and the Two Breakevens
The chart turns the four legs into one picture. Left to right is the SPX price at expiration; up and down is profit or loss. The green expiration line is the tent:
- Flat at the full $650 credit between the short strikes, 7450 and 7700
- Sloping down through a breakeven on each side
- Flat at the $4,350 max loss below 7400 and above 7750
Each BE marker is a short strike shifted by the credit: 7450 − 6.50 = 7443.50 on the put side, and 7700 + 6.50 = 7706.50 on the call side.
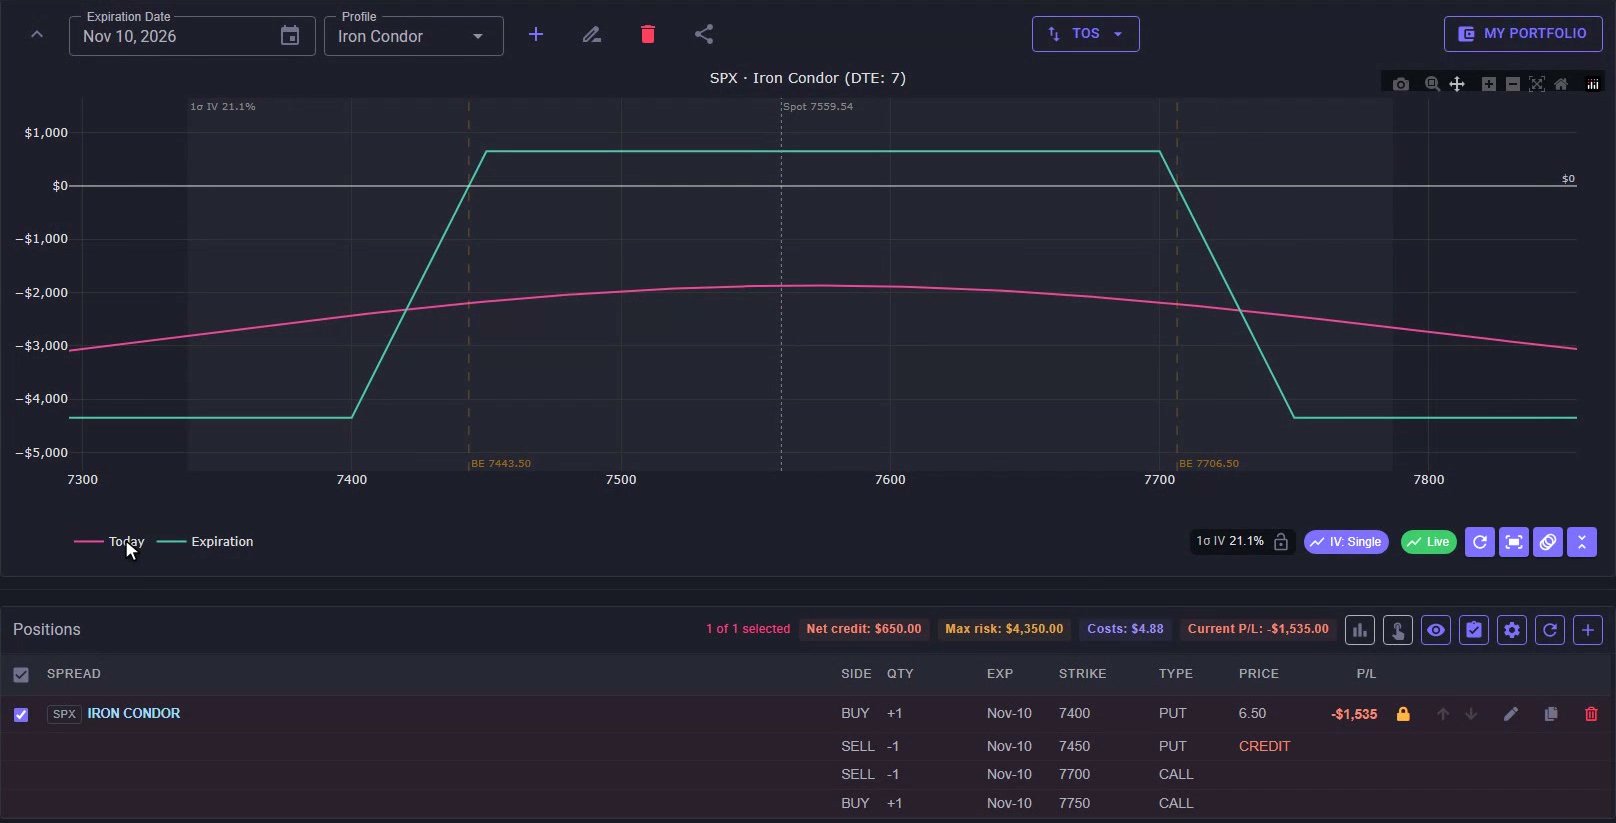
The tent: full credit between 7450 and 7700, breakevens at 7443.50 and 7706.50, and max loss beyond the wings, with the chips and all four legs below.
Step 8: The Today Line, Spot and the One-Sigma Band
The pink line is today: where the condor would stand if SPX moved to that price right now. All four options still have time value, so the line curves under the tent instead of kinking at the strikes. The dotted line is the current index price. The shaded band is one standard deviation, the move the options market is pricing in through expiration, taken from the implied volatility in the IV chip. The Live chip means quotes are streaming, so the pink line and the P/L column update on their own.
Step 9: See It on Strategy Summary
Saving the profile also feeds the Strategy Summary page under Tools. On the Upcoming Expirations tab, the November 10 row has picked up the condor: one transaction, four legs, the credit booked so far net of estimated fees, max risk straight from the profile, and ROI, which is that credit divided by the max risk. The icon in the Risk Profile column jumps straight back to the saved profile.
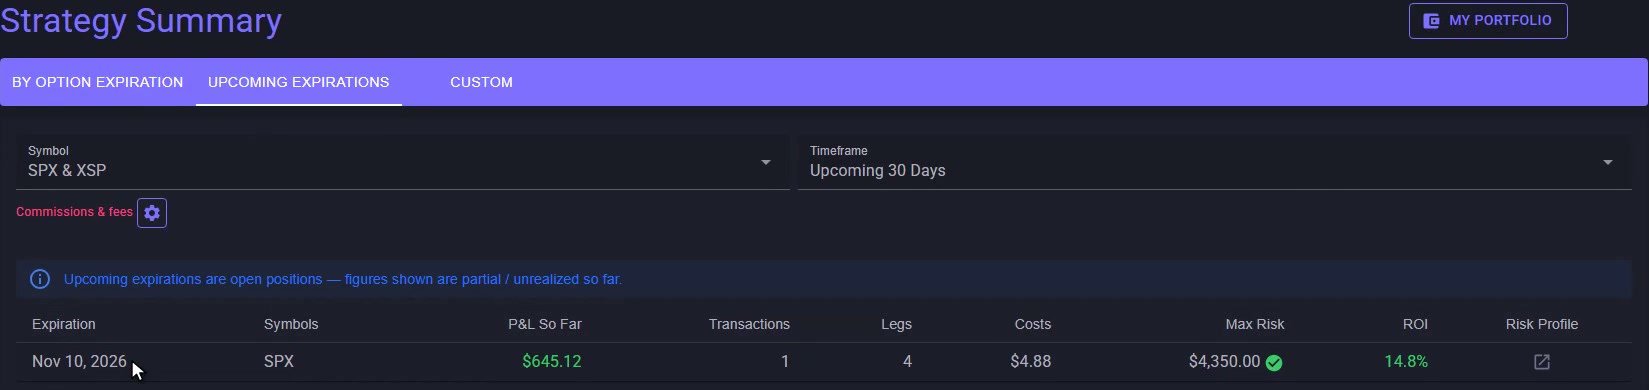
Strategy Summary, Upcoming Expirations: the Nov 10 row with the profile’s $4,350 max risk and a 14.8% ROI.
From Entry to Expiration
SPX credit spread and iron condor transactions on the cost basis side feed the summary, the profile supplies the risk, and the two stay linked by expiration date. That is an iron condor in MyATMM: four legs, one tent, two breakevens and one max loss, tracked from entry to expiration. If you are comparing tools for this kind of position, see the best iron condor tracker apps for 2026.
Risk Disclaimer
Options trading involves risk and is not suitable for all investors. Past performance does not guarantee future results. This content is for educational purposes only and should not be considered financial advice. The positions shown are demo data. Always consult with a qualified financial advisor before making investment decisions.
Related Reading
- How to build and read an SPX call credit spread risk graph — one wing of this condor, built on its own
- How to read a put credit spread risk graph: breakeven, max loss and today vs expiration — the other wing, from a saved profile
- How to track SPX and XSP option P&L by expiration — where this profile’s max risk and ROI show up
- Iron condor tracking: 0DTE QQQ and SPY examples
- The best iron condor tracker apps for 2026
Start Tracking Your Options Positions Accurately
MyATMM provides purpose-built cost basis tracking for option sellers, with the flexibility to track covered calls, cash-secured puts, and wheel strategy positions.
Track up to 3 tickers completely free forever. No credit card required.
Create Your Free Account TodayBuilt for covered calls, cash-secured puts, and the wheel strategy