What This Tour Covers
This is a three-minute tour of the MyATMM Risk Profile, the tool that draws the profit-and-loss picture for an options position both today and at expiration. The example is a demo account holding a single SPX put credit spread. It is a demonstration of a tracking tool: it shows how a position gets read and tracked, not what to trade. To see the same kind of spread entered from scratch, start with the SPX put credit spread walkthrough.
Step 1: Pick the Expiration and the Profile
Every profile is pinned to one expiration date. The date picker chooses the expiration, and the profile dropdown lists the named profiles saved for that date. The plus button starts a new one: pick the expiration, give it a name, and it is saved right away so spreads can be added to it.
Step 2: Read the Legs in the Positions Table
The Positions table holds the spread itself, a vertical on SPX with two legs:
- BUY +1 — the 7700 put, the long leg that caps the loss.
- SELL −1 — the 7750 put, the short leg that brings in the premium.
Both expire October 23. The price column shows the net credit per spread, 10.70, which is $1,070 on one contract. The second leg is tagged CREDIT, so it is clear money came in when the position was opened.

The Positions table: two legs, the net credit per spread, and the totals chips above it.
Step 3: Net Credit, Max Risk, Costs and Current P/L
The chips above the table total up the checked spreads:
- Net credit — the cash received, $1,070.
- Max risk — the most the position can lose.
- Costs — the estimated commissions and fees.
- Current P/L — where the position stands right now against its entry price, updated from live quotes.
Step 4: Read the Expiration Line and Breakeven
The chart turns those legs into a picture. Left to right is the SPX price at expiration; up and down is profit or loss in dollars. The green Expiration line is the payoff if the position is held to the end: flat at the full credit above 7750, flat at the max loss below 7700, and a straight slope in between.
The marker labeled BE is the breakeven: the short strike minus the credit, 7750 − 10.70 = 7739.30.
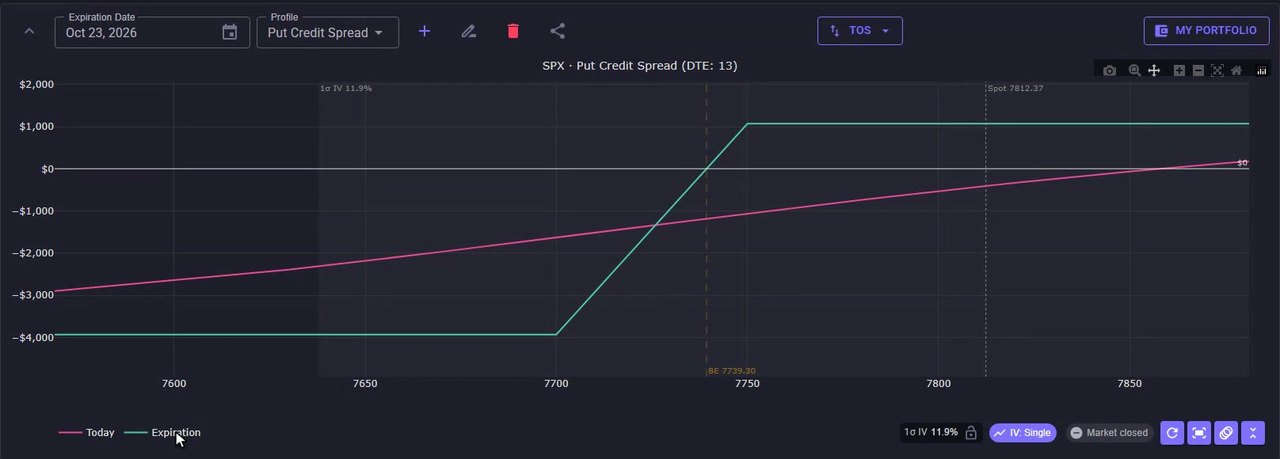
The Risk Profile chart: green is expiration, pink is today, BE marks the breakeven.
Step 5: The Today Line, Spot and the One-Sigma Band
The pink Today line is where the position would stand if SPX moved to that price right now, with time value still in the options. That is why it is a smooth curve instead of a hockey stick. The dotted Spot line is the current index price.
The shaded band is one standard deviation: the move the options market is pricing in through expiration, driven by the implied volatility shown in the IV chip. As days pass, the pink line settles toward the green one.
Step 6: Live Data Chips, Refresh and Fit
The chips in the corner of the chart report the data state. Market closed means the quotes are the last available ones, not streaming. When the market is open, live ticks flow in and the pink line and the P/L column update on their own. The refresh button re-pulls the spot price, and the fit button recenters the chart around the position.
Step 7: Lock, Edit, TOS Import/Export and Share
- Lock — freezes the entry price, so P/L is measured against the fill instead of drifting with the quote.
- Pencil — edits the legs in place.
- TOS menu — imports a position file from thinkorswim, or exports one back. For bringing a full thinkorswim trade history into cost basis, see the thinkorswim CSV import tutorial.
- Share — creates a read-only link to the profile.
From Entry to Expiration
Build the spread, read the chart, and track it from entry to expiration. The Risk Profile answers the three questions a credit spread raises every day: where is breakeven, what is the most this can lose, and where does it stand right now. For keeping up with spreads across several tickers once they are open, see the best credit spread tracker for options sellers in 2026. Three tickers are free forever, no credit card required.
Risk Disclaimer
Options trading involves risk and is not suitable for all investors. Past performance does not guarantee future results. This content is for educational purposes only and should not be considered financial advice. Always consult with a qualified financial advisor before making investment decisions. MyATMM is a tracking tool; nothing on this page is a recommendation to buy or sell any security.
Related Reading
- Risk Profile tool: SPX put credit spread walkthrough — entering the spread and saving the profile
- How to track SPX credit spreads and iron condors — the cost-basis side of the same positions
- The best credit spread tracker for options sellers in 2026 — how the trackers compare
- The best iron condor tracker apps for 2026
- Cost basis tracking for cash-secured put sellers: a two-minute tour — the companion tour of the dashboard
Start Tracking Your Options Positions Accurately
MyATMM provides purpose-built cost basis tracking for option sellers, with the flexibility to track covered calls, cash-secured puts, and wheel strategy positions.
Track up to 3 tickers completely free forever. No credit card required.
Create Your Free Account TodayBuilt for covered calls, cash-secured puts, and the wheel strategy