What This Tutorial Covers
Own 100 shares, sell one call against them, and what actually changes? This tutorial draws it on one risk graph in the MyATMM Risk Profile tool, on a demo account: the shares on their own first, then the covered call on top. It reads where the line bends, why it goes flat, how the option premium moves the breakeven, and how the same trade looks on the Cost Basis page. If risk graphs are new, reading a put credit spread risk graph covers the chart basics.
It is a demonstration of a tracking tool. Nothing here is investment advice; it shows how a position gets drawn and tracked, not what to trade, and SPY is only the example, not a pick.
Step 1: Create a Profile for a Stock or ETF
The plus button starts a new profile. The demo picks Stock or ETF instead of the SPX family, enters SPY as the ticker, names the profile SPY Covered Call and sets December 18 as the target expiration, about four weeks out. That date is for the call added later; the shares themselves never expire.
Step 2: Add 100 Shares and Read the Straight Line
Add First Spread opens the editor, and the type picker switches it from options to shares: 100 shares of SPY bought at $690. The check mark saves it, and the chart draws the shares on their own.
The green line is the position at expiration. For shares alone it is a straight diagonal: every dollar SPY moves is $100 on the position, up or down, with nothing capping it on the way up. It crosses zero at 690, the purchase price, and the Net spent chip shows the $69,000 that went in.
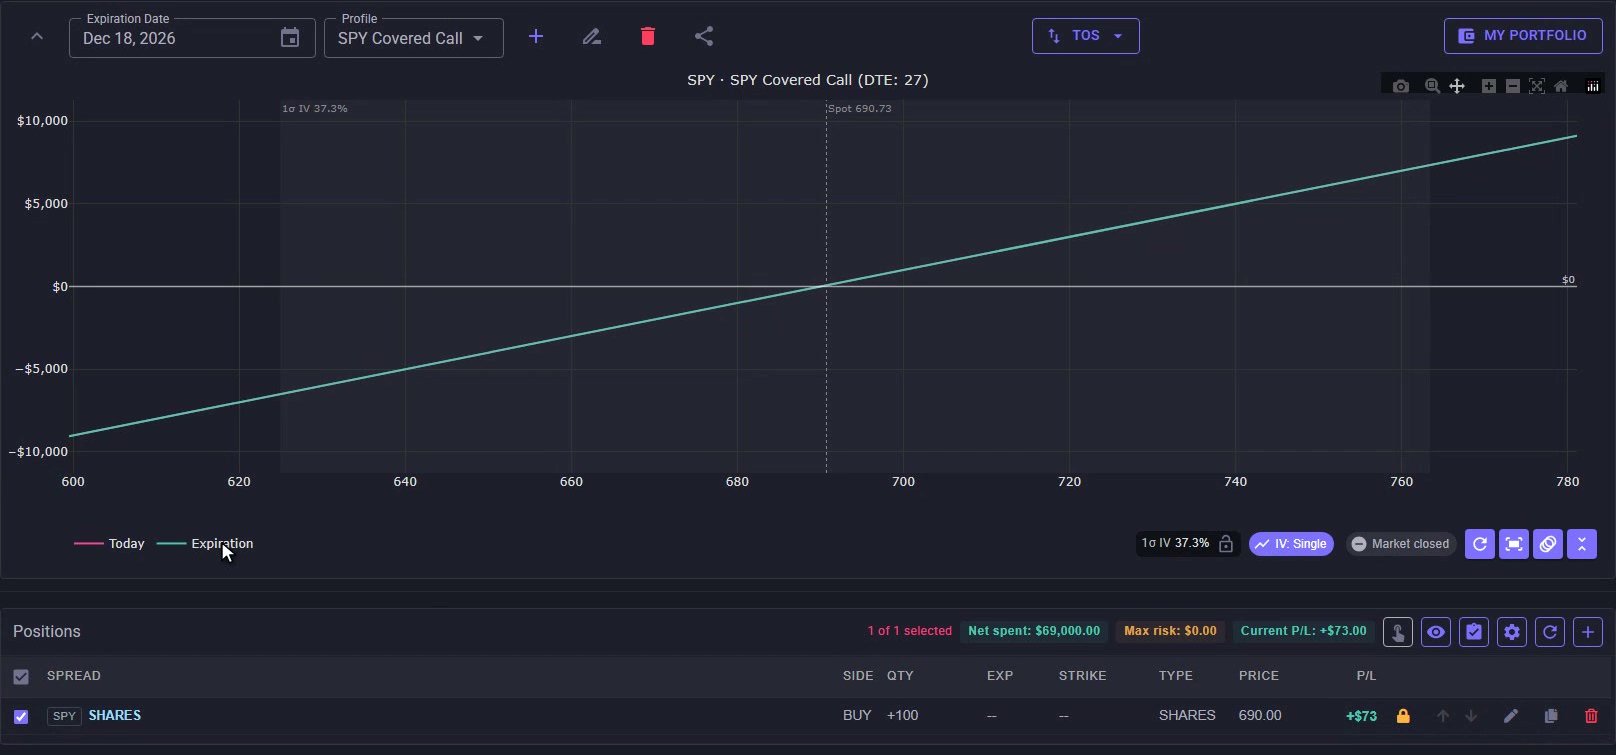
100 shares on their own: a straight line through the $690 purchase price with no ceiling on either side.
Step 3: Sell One Call Against the Shares
The plus button adds a second spread to the same profile. It starts as a two-leg vertical, so one leg comes off, leaving a single call, and the swap arrows flip it from buy to sell. The strike is 720, $30 above the purchase price, on the same December date.
The lock switches the price to manual entry: $10 a share, entered as a credit because selling the call brings cash in. One contract covers 100 shares, so that is $1,000. The check mark saves it, both rows are on the chart, and Net spent drops to $68,000.
Step 4: Read the Capped Upside
At expiration, the covered call line reads in three parts:
- Below 720, it runs parallel to the shares, $1,000 higher: that is the premium
- At 720 it bends and goes flat at +$4,000: the $30 gain on the shares plus the $10 premium, times 100
- Above 720, the shares get called away at the strike, so nothing more is added. That is the capped upside
Step 5: Compare It With the Shares Alone
Hover Help draws any single row’s own line. Hovering the shares row puts the shares-only line back on the chart as a dashed amber line, so the two can be compared directly:
- Below 730, the covered call sits above the shares
- At 730, the strike plus the premium, the two lines cross
- Above 730, the shares alone keep climbing while the covered call stays flat
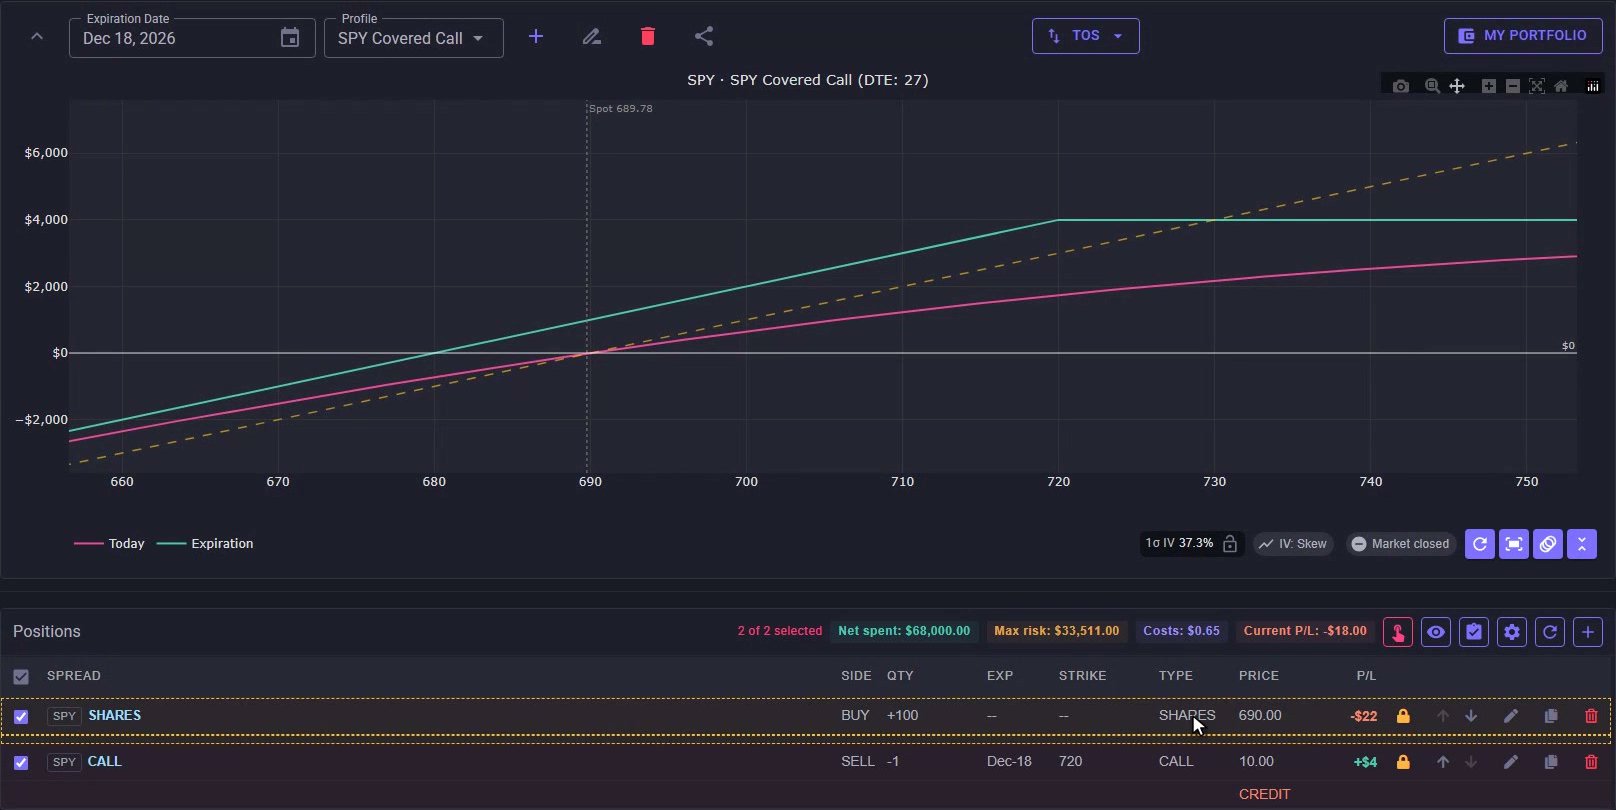
The covered call (green) goes flat above 720; the dashed shares-only line crosses it at 730 and keeps climbing.
Hovering the call row shows the other half: a flat $1,000 while SPY stays under 720, then it gives the gains back dollar for dollar above it. That is the exchange inside a covered call, the premium now for the upside past the strike. On the downside, the breakeven moves from 690 to 680, the purchase price minus the premium.
Step 6: See the Same Trade on the Cost Basis Page
The Cost Basis page records the same trade as two transactions. For SPY, Cost Basis reads $680 a share, next to CB-Prem at $690, the cost before the premium. That 680 is the same breakeven the chart draws. The Calls tab lists the open 720 call, expiring December 18.

Cost Basis $680 after the $1,000 premium, next to CB-Prem $690 before it.
Same Line Below the Strike, Flat Above It
That is a covered call on one risk graph: the shares’ line below the strike, lifted by the premium, and flat above it. The weekly bids and ROI for covered calls across many tickers are on the screener, covered in how to screen covered calls and cash-secured puts. To keep premium and cost basis straight across many trades, see how to track covered calls and cash-secured puts.
Risk Disclaimer
Options trading involves risk and is not suitable for all investors. Past performance does not guarantee future results. This content is for educational purposes only and should not be considered financial advice. The positions shown are demo data. Always consult with a qualified financial advisor before making investment decisions.
Related Reading
- How to track covered calls and cash-secured puts
- How to screen covered calls and cash-secured puts — weekly bids, ROI and filters
- Cost basis tracking for cash-secured put sellers — the Cost Basis page in full
- How to read a put credit spread risk graph — breakeven, max loss and Today vs Expiration
- When covered call tracking spreadsheets break down
Start Tracking Your Options Positions Accurately
MyATMM provides purpose-built cost basis tracking for option sellers, with the flexibility to track covered calls, cash-secured puts, and wheel strategy positions.
Track up to 3 tickers completely free forever. No credit card required.
Create Your Free Account TodayBuilt for covered calls, cash-secured puts, and the wheel strategy